
Nitrous Oxide: The Environmental Impact of Recreational Use
An overlooked climate feedback loop?

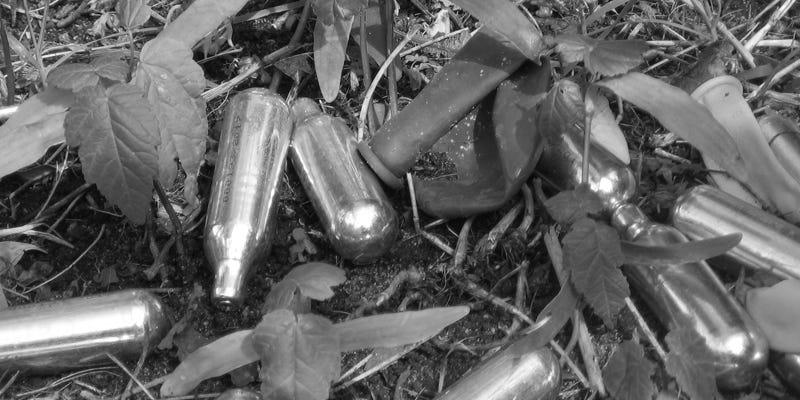
In the course of walking around this suburban neighborhood over the last few years the increase in destructive drug use is obvious from the litter. Destructive in this sense referring to the environmental impact rather than the effect on the user. Whilst most long-term drug users may notice some health issues or social impacts and are routinely bombarded with such warnings few probably consider the broader impact to the world around them.
As recreational drugs go it seems unlikely that any exceed the environmental damage caused by nitrous oxide on a dose by dose basis for the simple reason that N2O is 298 times more potent than carbon dioxide as a greenhouse gas. This means that every 1 kg of N2O that is released into the atmosphere has the warming effect of 298 kg of CO2.[1]
Many articles in recent years have suggested that use is on the rise and casual observation would suggest the same. In some suburban areas it is now impossible to walk for five minutes in any direction without coming across ‘disposable’ vapes or parts of them strewn and smashed in the road, piles of beer cans and caches of dumped nitrous oxide canisters.
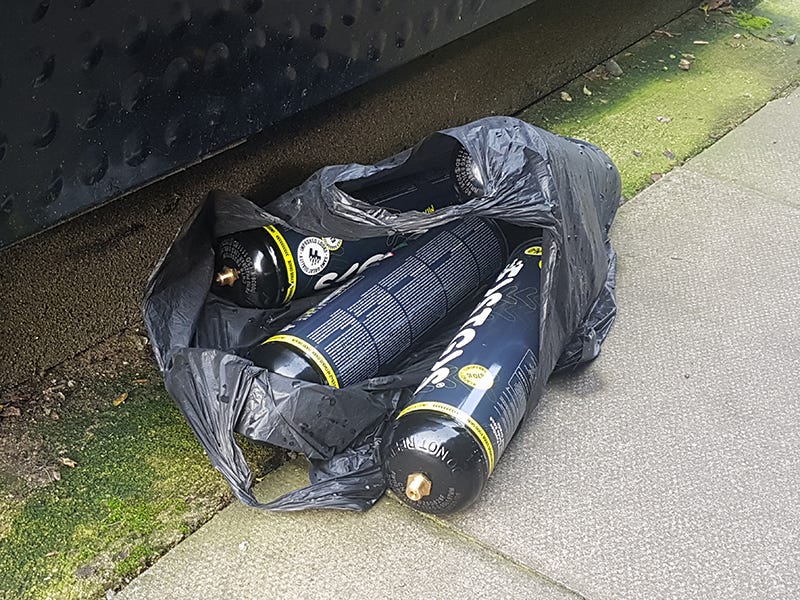
At first you would see the odd 8 g canister here and there, then it started to become piles of several by the side of the curb, then it escalated to large steel canisters the size of a car fire extinguisher which each contain 670 g of N2O. It is not uncommon to see empty cardboard boxes of six canisters thrown out with people’s recycling or to find piles of several of these large canisters dumped by the side of the road.
This increase in use is also reflected in the products available online with one of the most common brands now selling 2 kg canisters of fruit flavored gas with each canister including a QR code to verify that it is authentic, presumably to counter a secondary black market trade in fake drugs.
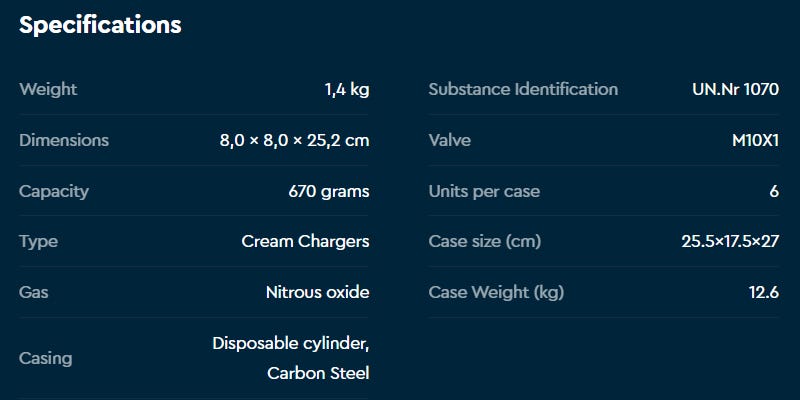
For now the most common form to encounter seems to be the 1.4 kg canisters each of which contains 670 g of pure N2O which is equivalent to 199.66 kg of CO2. The remaining 730 g of the bulk is carbon steel plus a plastic nozzle and base. Assuming 700 g of steel per canister and 2.18 tons of CO2e per metric ton of steel[2] that adds another 1.526 kg of CO2e per canister. This is without taking into account the emissions produced in every step of shipping and delivering these canisters.
Unlike nitrous oxide used as an anesthetic in dentistry where it may be applied at concentrations ranging from 30-70%, recreational users are inhaling pure N2O. Only minimal amounts of this inhaled nitrous oxide are metabolized in the body with the bulk being exhaled[3] such that it can still be detected on a user’s breath at least 60 minutes later.[4] As such the majority of this N2O will be released into the atmosphere. Consequentially the environmental impact of this drug use is quite staggering as can be seen with some basic calculations.
For the sake of simplicity let’s just round the figure to 200 kg CO2e per canister and call it 1,200 kg CO2e per box of six canisters. To put this into perspective a return flight from London to New York emits 986 kg of CO2 per passenger or 1,650 kg for a return flight from London to Los Angeles.[5]
Extreme usage
A study of 128 patients seeking treatment for an N2O use disorder determined that the median number of days in which N2O was used was 10 days per month with a range of 2-10 kg and a median of 5 kg consumed on each of these days.[6] The median user here then would be using 50 kg of N2O per month for a total of 600 kg per year. This would equate to 895.5 of these 670 g canisters and therefore approximately 179,104 kg or 179.104 tons of CO2e per year.
This would be equivalent to 181 return flights from London to New York and is 16.73 times higher than the 10.7 tons CO2e annual per capita average of the EU.[7]
The typical flight time from London to New York is 8 hours and 7 hours in the other direction owing to the jet stream. This level of N2O usage then is equivalent to 2,715 hours in the air or around 31% of your year spent flying.
600 kg of nitrous oxide would provide 75,000 hits if delivered in 8 g doses via a balloon with the high from each hit lasting for around 1-3 minutes so this would be a total of 75,000 - 225,000 minutes or 1,250 - 3,750 hours spent under the influence in a year. If each hit lasted for 2 minutes then it would equate to 2,500 hours so the carbon footprint per hour compares closely to flying.
The level of usage required to reach these incredible figures is of course on the extreme end and does not represent the typical user.
Typical usage
In 2021 the Global Drug Survey collected data on 32,022 people in 22 countries and showed that 9.7% of participants said they had used N2O in the last year.[8] Other studies have shown that the typical behavior is occasional use on the weekends with nightlife attendees using four balloons on a night out[9] of which each balloon contains 8 grams of N2O.[10]
In 2022 a survey in the United Kingdom showed that 1.3% of adults aged 16 to 59 had used N2O in the last year equating to 444,000 people.[11] If each of these people used one 8 gram balloon per year that would be 3,552 kg of N2O with a CO2e of 1,058,496 kg equivalent to around 1,073 passengers flying from London to New York and back. If each person used one balloon every weekend it would equate to around 55,823 passengers making such a flight and if they used four balloons every weekend it would be equivalent to 223,293 passengers. Even when viewed from this perspective of fairly moderate recreational drug use the figures quickly become astonishingly high.
Comparison with other drugs
If a user consumed 8 grams of N2O per day they would generate 870.16 kg CO2e annually and if a population of 50 million consumed 8 grams of N2O per day it would equate to 43,508,000 metric tons of CO2e. If a heavy user consumed 500 g per day it would generate 54,385 kg CO2e annually equating to 2,719,250,000 tons if multiplied by 50 million people.
Beer
500ml of locally produced lager has a CO2e of 692 g whereas internationally produced lager is 759 g CO2e.[12] Another study on Danish breweries gives a figure between 400 g and 1,500 g per liter.[13] With a per capita annual consumption rate of 68 liters in the UK in 2022,[14] assuming internationally produced lager, an adult population of 50 million each consuming this amount this would equate to 5,161,200 metric tons CO2e. A consumption rate of one 500ml beer per day would produce 277.035 kg CO2e annually per person or 13,851,750 t CO2e for 50 million people. Or if a heavy drinker consumed 2 liters of internationally produced lager every day they would generate 1,108 kg CO2e annually equating to 55,407,000 tons if 50 million people drank this much.
Wine
Wine produces 1.9 - 5.3 kg CO2e per liter with the upper range of this figure factoring in wine that is transported over a longer distance.[13] Assuming a figure of 5 kg CO2e per liter and a consumption rate of one 250 ml glass per day this would equate to 456.25 kg CO2e annually per person or 22,812,500 t CO2e for 50 million people drinking one glass a day. If one 750 ml bottle were consumed per day this would equate to 1,368.75 kg CO2e annually per person or 68,437,500 t CO2e if 50 million people consumed this amount. This value could be expected to be half as much in wine producing regions.
Spirits
The range for spirits is given as 0.8 - 2.3 kg CO2e per liter.[13] Assuming 2.3 kg per liter and a consumption of 100ml per day this would equate to 83.95 kg CO2e or 4,197,500 for 50 million people. A consumption rate of 200ml per day would be a similar amount of units to the higher end values used for beer and wine and would result in 167.9 kg CO2e per person annually or 8,395,000 for 50 million people.
Cigarettes
One cigarette equates to around 14 g CO2e[15] resulting in an occasional smoker generating 5.11 kg CO2e annually if they smoke one cigarette per day, 51.1 kg CO2e with a ten a day habit or 306.6 kg CO2e if they smoke sixty a day. Therefore if 50 million people had this habit it would amount to 255,500 t / 2,555,000 t / 15,330,000 t CO2e at one / ten / sixty a day respectively.
Cannabis
For cannabis that is cultivated indoors using grow lights and ventilation figures range from 2,283 - 5,184 kg CO2e per kg of dried flower.[16] Assuming a figure of 5,000 kg per kg, an average of 0.3 g cannabis[17] in a joint and a consumption rate of one joint per day a user would generate 547.5 kg CO2e annually. Multiplied by 50 million people this habit would generate 27,375,000 t CO2e. A high consumption rate of 1 g per day would produce 1,825 kg CO2e annually per person or 91,250,000 t for 50 million people.
Coffee
A cup of coffee made with an automatic machine produces 60.27 g CO2e whereas for filter drip and French press it is 10.04 g.[18] Assuming French press, consuming one cup of coffee per day would generate 3.66 kg CO2e annually or 14.65 kg for four cups per day. 50 million people with this habit would therefore produce 183,230 t or 732,920 t CO2e respectively.
Cocaine
Cocaine is estimated produce 590 kg CO2e per kg.[19] Assuming a habit of one 0.1 g line per day this would equate to 21.53 kg CO2e annually or 215.35 kg for a 1g per day habit. If 50 million people had this habit it would equate to 1,076,750 t or 10,767,500 t CO2e.
Sugar
The footprint for a 1.5 liter bottle of soda in Europe is 251 g CO2e.[20] So a consumption rate of one of these bottles per day for a year would generate 91.615 kg CO2e or 4,580,750 t CO2e for 50 million people. For a gummy bears candy the footprint is 1.84 kg CO2e per kg[21] so the consumption of one 175 g bag per day would generate 117.53 kg CO2e per person annually or 5,876,500 t CO2e for 50 million people. For a low end use figure assume just the 1.5 liters of soda and for a high end add the bag of candy for a value of 209.145 kg CO2e per person or 10,457,250 t for 50 million people.
Vaping
This is going to be a tricky one as there appears to be insufficient studies from which to quickly pull data. Additionally due to the presence of lithium, metal, rubber, plastic, PCBs and other components in disposable vapes it presents substantial ecological issues which may outweigh those of the emissions. e.g. Lithium ion batteries leaking into the ground or smashed plastic shards being consumed by animals are issues that generally are not going to occur with the other drugs discussed here.
The base for E-liquid for vaping is typically 70% vegetable glycerine and 30% propylene glycol with the flavor and nicotine components being added in small concentrations and also using a propylene glycol base. CarbonCloud gives a value of 2 kg CO2e per kg of glycerol[22] and 6.34 kg for propylene glycol.[23] Aqua Calc suggests that 1 kg of glycerine or glycerol has a volume of 0.79 liters.
Based on these figures 1 kg of 70% VG/30% PG vaping liquid would have a footprint of 3.302 kg CO2e and for one liter it would be 4.18 kg CO2e. Therefore if a user is consuming 10ml of E-liquid a day then the annual CO2e will be 15.257 kg or 762,850 t for 50 Million people. This is without including nicotine or flavoring as there appears to be insufficient data to calculate this. It also does not account for emissions generated by the factory mixing the E-liquid or transport to the end user so the true figure can be expected to be higher.
Weighing a few empty 10ml PET bottles in which E-liquid is supplied resulted in an average weight of around 6.5g. Recycled PET has a footprint of 0.45 kg CO2e per kg or 2.15 kg CO2e per kg for virgin PET.[24] Therefore assuming this higher figure and a use rate of one 6.5 g bottle per day the annual emissions would be 5.1 kg CO2e per person or 255,043.75 t for 50 million people.
As a rough estimate of the power used assume one 3500 mAH 18650 battery is charged and depleted each day. At 3.7 volts this equates to 12.95 watt hours resulting in a total use of 4.72675 kWh annually. At a rate of 500 g CO2e per kWh this would produce 2.36 kg CO2e or 118,000 t CO2e for 50 million people, though will vary based on region and power production methods used.
Adding these figures together results in a rough estimate of 22.717 kg CO2e for one person consuming 10ml of liquid, one bottle and one battery charge per day or 1,135,893.75 t CO2e for 50 million people. For a higher use figure which assumes two 10 ml bottles and two battery charges are consumed per day the result would be 45.434 kg CO2e per person or 2,271,700 t CO2e for 50 million people.
These figures are assuming a reusable vape with replaceable/rechargeable batteries and do not account for the cotton wicking material used, the coils which need replacing or the construction of the battery and vaping device. So the figure can be expected to be higher were this included and even higher still for a disposable vape in which the entire unit plus battery are regularly thrown away and replaced.
Analysis
The following table is based on the figures presented thus far assuming a 10 a day habit for cigarette low use/60 for the high use, 500ml of beer a day for low use/2 liters a day for high use and so on. The values used for N2O use are 8 g a day for low use and 500 g a day for high use.
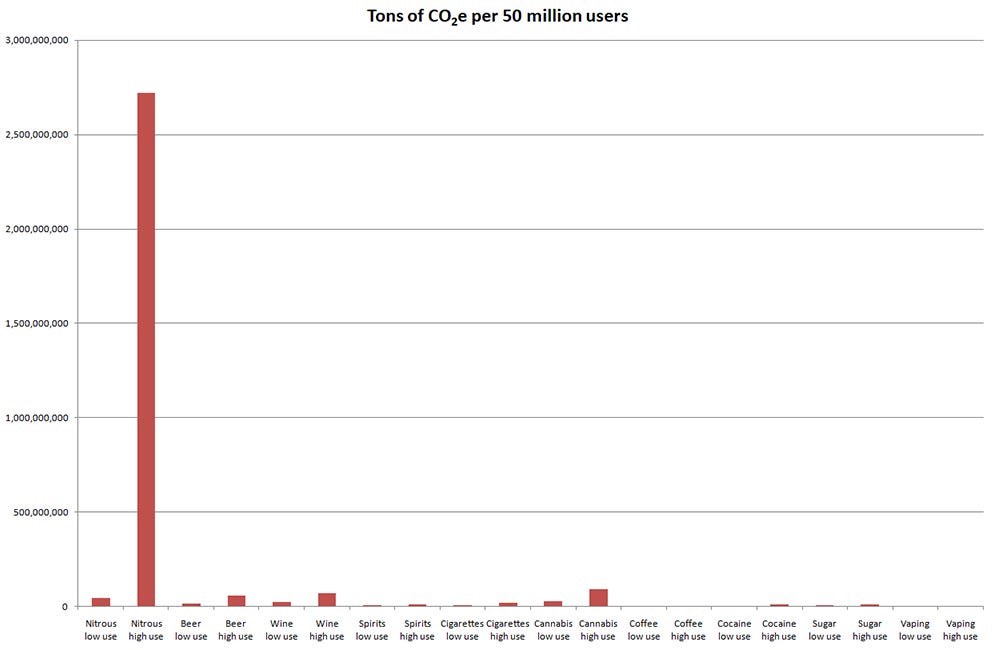
Right… so it appears that the impact of this N2O usage is so extreme that it just breaks the chart entirely. This should warrant double checking the calculations:
500 g / 1000 = 0.5 kg N2O per day.
0.5 kg x 365 = 182.5 kg per year.
182.5 kg × 298 = 54,385 kg CO2e.
54,385 kg CO2e × 50,000,000 = 2,719,250,000,000 kg CO2e.
2,719,250,000,000 / 1000 = 2,719,250,000 tons CO2e.
The off the chart figure is correct though 500 g per day does represent high usage. Browsing social media it is common to find accounts from people consuming one or more of these large canisters every weekend or even every day, though it is unclear for what duration they can maintain this lifestyle before the health consequences force them to stop. However for now let’s just use a lower figure for the high use and say 100g per day which would equate to 10,877 kg CO2e per user or 543,850,000 t CO2e per 50 million users.
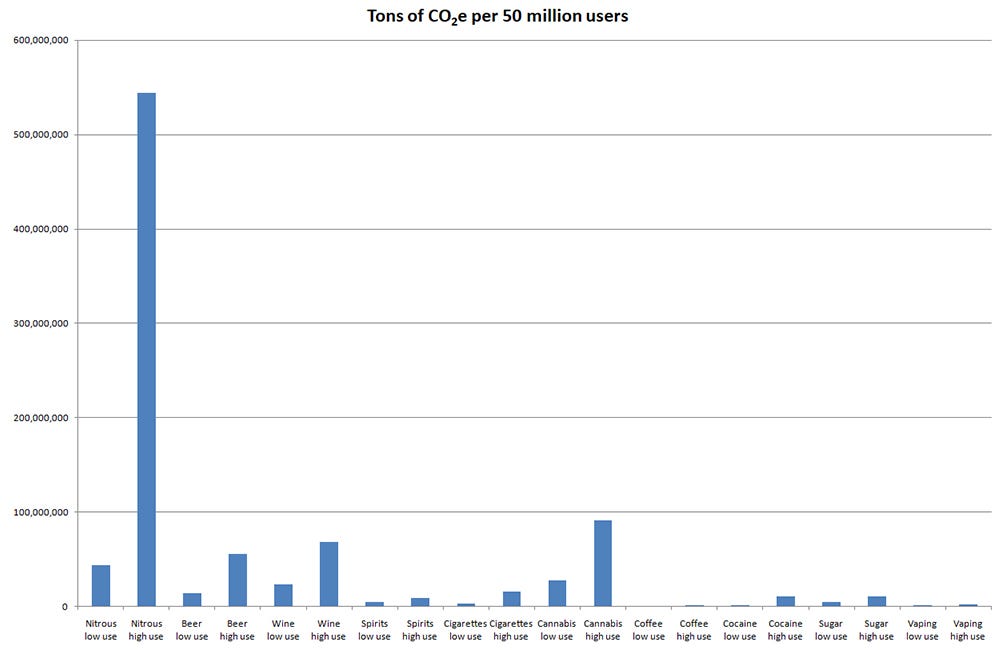
It’s still pretty much off the chart so let’s increase the use of the other drugs to more abusive levels and assume 4 liters of beer a day, two bottles of wine a day, 400 ml of spirits a day and add ten cigarette’s a day to the high cannabis use to account for rolling with tobacco and the rolling paper. We’ll also double the sugar, double the high coffee use to eight cups a day and assume the more energy intensive machine is used for the coffee resulting in 8,799,420 t CO2e per 50 million people.
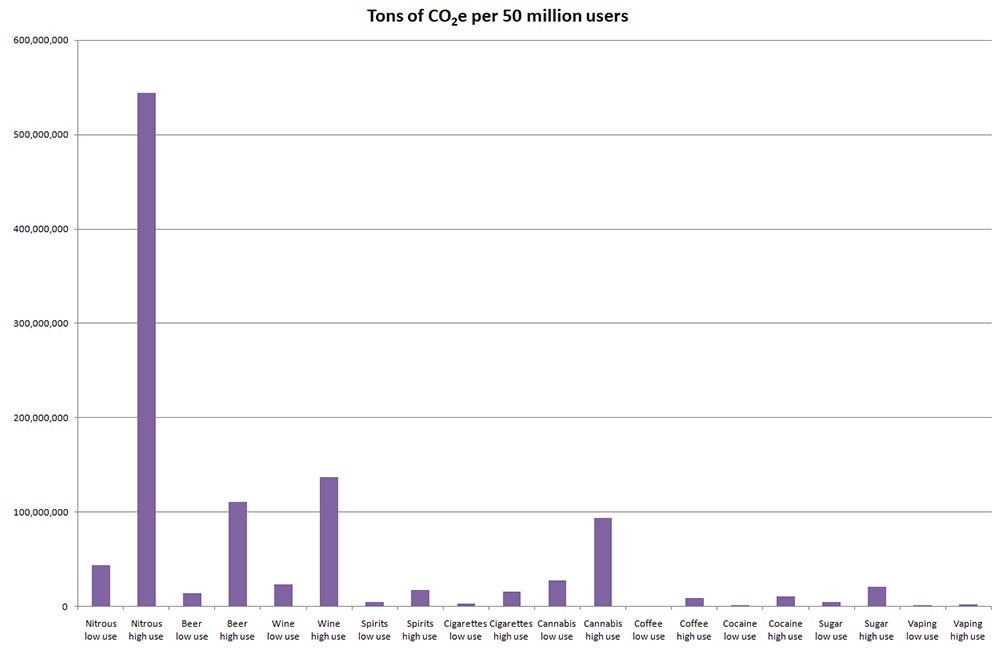
Clearly the climate impact is still absurd. The high use alcohol figures here would be in the range of someone drinking 16-20 units every day and whilst that might likewise result in poor physical and mental health it still doesn’t compare with the N2O in terms of greenhouse gas emissions. This is still just the lower end 100g per day N2O use which is far short of the figures seen in serious abuse cases. Even if a user was consuming a sum total of two bottles of wine a day, 1 g of cannabis in approximately four joints a day, 3 liters of soda and two bags of candy daily, drinking 8 cups of coffee and somehow maintaining a 60 a day smoking habit on top of all that it still wouldn’t come close to the climate impact of the N2O.
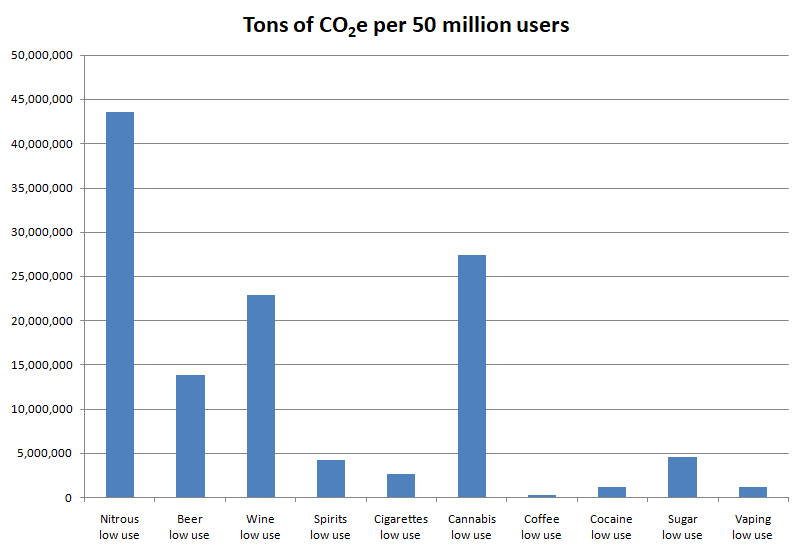
Comparing just the low end use the situation is the same. This chart shows 8 g per day N2O compared with 500 ml of beer, 250 ml of wine, 100 ml of spirits, 10 cigarettes a day, one joint a day using indoor grown cannabis, one cup of French press coffee, one 0.1 g line of cocaine, 1.5 liters of soda and 10 ml of vaping liquid plus a battery charge using a reusable vaping device. The wine figure could be expected to be reduced by half if it was locally produced and the cannabis would be vastly lower if it were grown outside or in a greenhouse without artificial lighting. The N2O figure however cannot be lowered by any such changes due to the fundamental effect of the molecule in the atmosphere.
Duration of use
The data seems to consistently suggest that N2O use as a recreational drug far exceeds the carbon dioxide equivalent emissions produced by other drugs. However this is not taking into account the duration for which these drugs are used at these abusive levels.
In the UK a pack of six 670 g N2O canisters can be ordered online for £100 whilst a single canister goes for around £20-22. In Germany one canister can cost €27 or €150 for a case of six. In the US one 2,112 g canister can cost $83 or $600 for ten. Assuming ordering in bulk this would mean a 5 kg per month habit would cost around £124, €186 or $142. As such it can be seen as quite affordable compared to many other drugs though presumably the extreme users consuming 50 kg per month were incurring some serious financial issues as a result.
Amongst the extreme end users who were seeking treatment the history of usage ranged from 1-4 years with a median of 2 years whereas for cocaine users seeking treatment the range was 2-7 years with a median of 3 years.[6] Though the study also noted that the N2O users were significantly less likely to complete their treatment than the cocaine users so it is unclear how long they continued using for at these levels.
This as well as the health issues may suggest a shorter overall period of usage of N2O compared to other drugs which may form long-term habits or be consumed on small scales recreationally for life. Subsequently it seems fair to take this shorter duration of use into account.
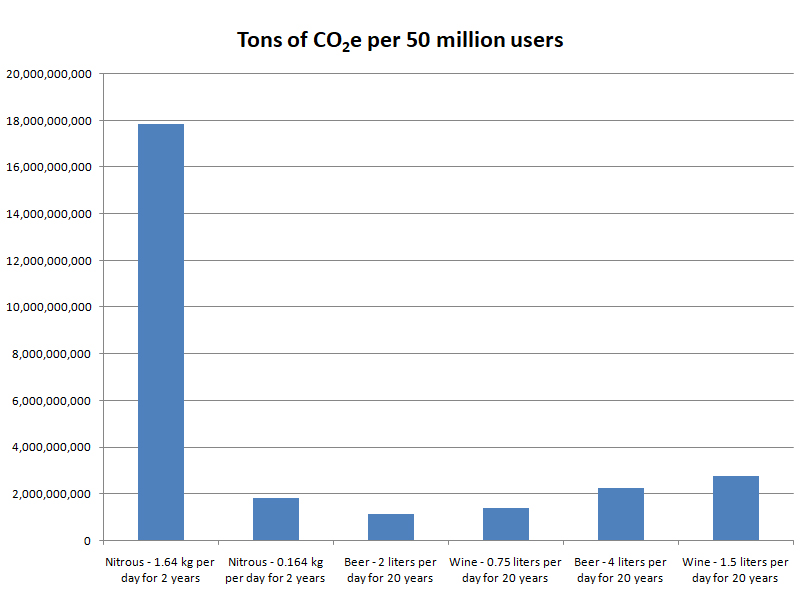
So let’s consider the extreme scenario presented of users consuming 5 kg of N2O ten times a month for a total of 50 kg per month or 600 kg per year. This would equate to approximately 1.64 kg per day. If 50 million people consumed this quantity for 2 years it would produce 17,838,280,000 t CO2e.
Whereas if 50 million people maintained a habit of 2 liters of beer a day for 20 years it would produce 1,108,140,000 t CO2e and if 50 million people consumed one 0.75 liter bottle of wine a day for 20 years it would produce 1,368,750,000 t CO2e. Even if these figures were doubled to 4 liters of beer or two bottles of wine daily they are still a long way short of the environmental damage that can be caused in two years of extreme N2O use. If the N2O use was reduced from 50 kg per month to 5 kg per month 50 million users would still exceed the beer and wine figures and result in 1,788,000,000 t CO2e in two years.
Conclusion
Due to the fact that nitrous oxide has 298 times the impact on the planet as CO2 it can be seen as incredibly destructive for the environment in even the lowest recreational use scenarios. The extreme use case scenarios where users are consuming several kilograms of N2O every month would appear to represent fairly catastrophic consequences for the environment if more people used at this level.
If users needed another reason to quit besides from the vitamin B12 deficiency and serious long-term physical and neurological damage caused by regular inhalation of N2O then the climate impact may provide that. One thing that becomes quickly obvious from looking at social media spaces about nitrous oxide is how many people are discussing their problematic use and how many other users are urging them to stop. So it is not as if users are oblivious to the health issues they are facing or too far gone to care. Hence it is reasonable to assume that they would not ignore the climate issues if they were more aware of them.
The figures are so extreme that it makes it hard to conceive of any other drugs that might exceed these emissions levels. Drug smuggling of illicit substances like heroin and fentanyl will increase emissions associated with those drugs by virtue of smaller quantities being smuggled by mules on planes or hidden in vehicles, as opposed to the more efficient mass transport utilized by legal drugs. However when a single N2O user is able to produce the cumulative emissions of hundreds of airline passengers in just a year of abusive use then it seems doubtful that even the most wasteful smuggling operation would add much to the end user’s drug associated footprint by comparison.
There are numerous studies showing that recreational N2O usage is on the rise in countries around the world and just as many studies discussing the impact of N2O on the environment. However few seem to have considered the environmental impact of increasing recreational use. Currently the environmental impact of recreational N2O use is surely dwarfed by flights and automotive travel but as these figures demonstrate it would not seem difficult for that to sway in the other direction if more people started using.
As society continues to decline and life becomes worse and harder for the average person it can be expected that recreational drug use will increase as a means of coping with this reality. The combination of the relatively low cost, easy accessibility and quick euphoric high may result in more people turning to N2O as an escape and in so doing escalating the decline of the environment and therefore society. This may represent an anthropogenic feedback loop that has been largely overlooked.
References
Banner image license CC BY-SA 4.0, Hansmuller, Wikimedia Commons. Image desaturated and cropped. Original image: https://commons.wikimedia.org/wiki/File:Nitrous_oxide_whippits_used_recreationally_as_a_drug_by_Dutch_youngsters_near_a_school,_Utrecht,_2017_-_2.jpg
[1] https://climatechangeconnection.org/emissions/co2-equivalents/
[2] https://worldsteel.org/wider-sustainability/sustainability-indicators/
[3] https://journals.sagepub.com/doi/10.1177/0960327111401437
[4] https://www.nature.com/articles/s41598-025-86666-9
[5] https://www.theguardian.com/environment/ng-interactive/2019/jul/19/carbon-calculator-how-taking-one-flight-emits-as-much-as-many-people-do-in-a-year
[6] https://pubmed.ncbi.nlm.nih.gov/39004071/
[7] https://ec.europa.eu/eurostat/web/products-eurostat-news/w/ddn-20250219-1
[8] https://www.globaldrugsurvey.com/wp-content/uploads/2021/12/Report2021_global.pdf
[9] https://www.euda.europa.eu/system/files/media/publications/documents/14934/20225054_PDF_TD0922561ENN_002.pdf
[10] https://www.euda.europa.eu/publications/topic-overviews/recreational-nitrous-oxide-use-europe-situation-risks-responses_en
[11] https://www.ons.gov.uk/peoplepopulationandcommunity/crimeandjustice/articles/drugmisuseinenglandandwales/yearendingjune2022
[12] https://www.imperial.ac.uk/news/185946/how-green-your-beer/
[13] https://scispace.com/pdf/lca-based-comparison-of-the-climate-footprint-of-beer-vs-3j6n08kvba.pdf
[14] https://brauwelt.com/en/international-report/europe-russia/646449-uk-beer-report-2022-the-numbers
[15] https://www.bvte.de/files/content/themen/nachhaltigkeit/umwelt/_Factsheet_Tabak_II_engl.pdf
[16] https://www.nature.com/articles/s41893-021-00691-w
[17] https://www.latimes.com/projects/la-me-weed-101-thc-calculator/
[18] https://rgs-ibg.onlinelibrary.wiley.com/doi/10.1002/geo2.96
[19] https://www.unodc.org/res/wdr2022/MS/WDR22_Booklet_5.pdf
[20] https://www.bieroundtable.com/wp-content/uploads/49d7a0_7a5cfa72d8e74c04be5aeb81f38b136b.pdf
[21] https://apps.carboncloud.com/climatehub/product-reports/id/1057426378790
[22] https://apps.carboncloud.com/climatehub/product-reports/id/16243501676
[23] https://apps.carboncloud.com/climatehub/product-reports/id/164129712801
[24] https://packagingeurope.com/study-confirms-the-excellent-carbon-footprint-of-recycled-pet/1923.article